Water data in PST - One year look back
The Perennial System Trial (PST) isn’t spatially extensive (about 1 hectare), but it’s densely instrumented. Take the soil water sensors: there are now more than 30 of them, and together they have recorded over 80,000 soil moisture measurements, with more arriving every day.
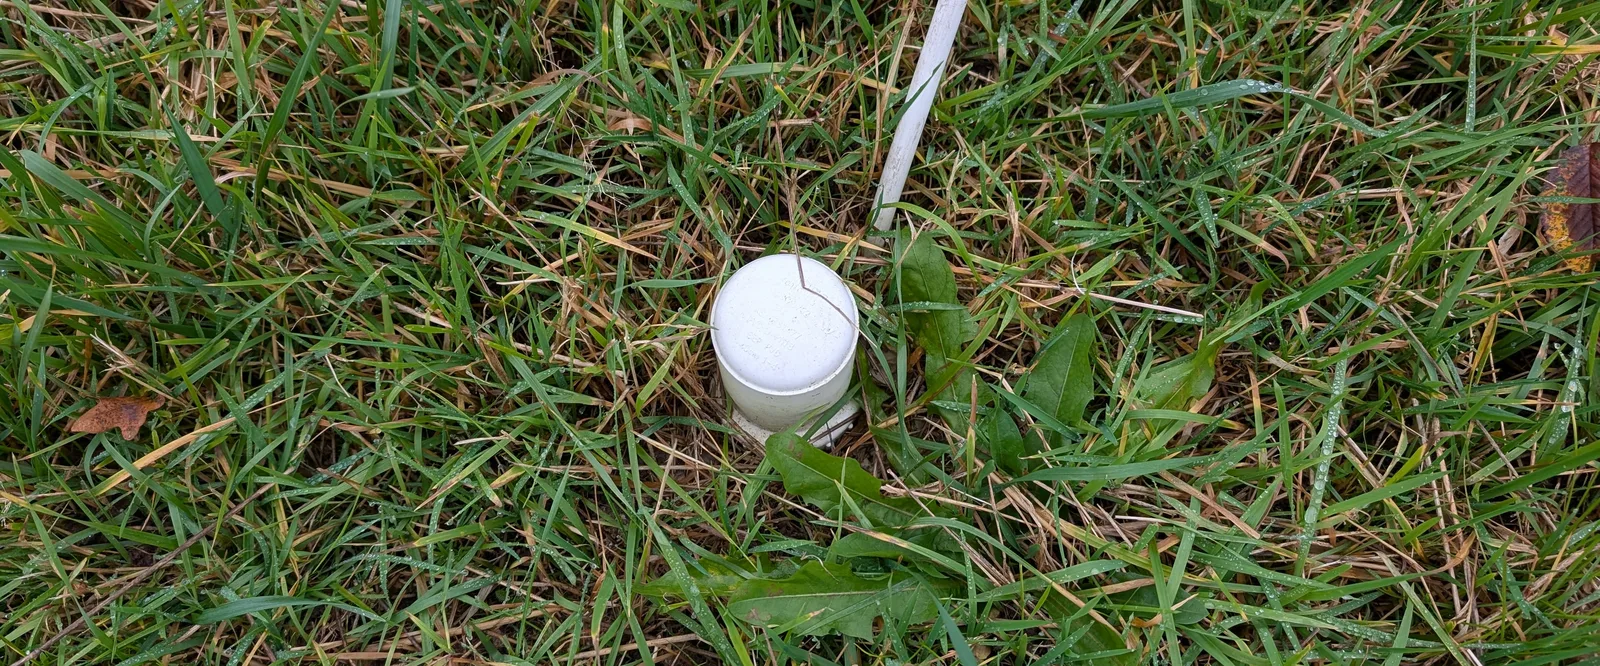
When Dr. Eusun Han, who secured the funding for the Deep Water project, told me he planned to install water sensors, I wasn’t expecting such a dense network. Once the automated sensors were in the ground and began sending us data point after data point, with no need for anyone to visit the field, I was both excited and a little cautious. How accurate were they, and how should we calibrate them? Now that every sensor has completed at least one full season, and I’ve applied a calibration based on the many soil samples we collected, it’s time to see what these data can tell us.
Soil moisture boundaries
First, we can identify the volumetric water content (VWC) boundaries captured by the sensors: the minimum and maximum soil moisture readings across each validated series. The figure below shows these boundaries averaged across the whole field trial. The minima (the driest conditions recorded) remain far from the permanent wilting point (PWP) estimated with pedotransfer functions, but the sensors tracked the field capacity (FC) trend quite well. The maxima at 130 and 150 cm exceeded the theoretical FC, which didn’t surprise me, for two reasons: the water table periodically rises into that zone, and the values are still below saturation, so they remain physically plausible.
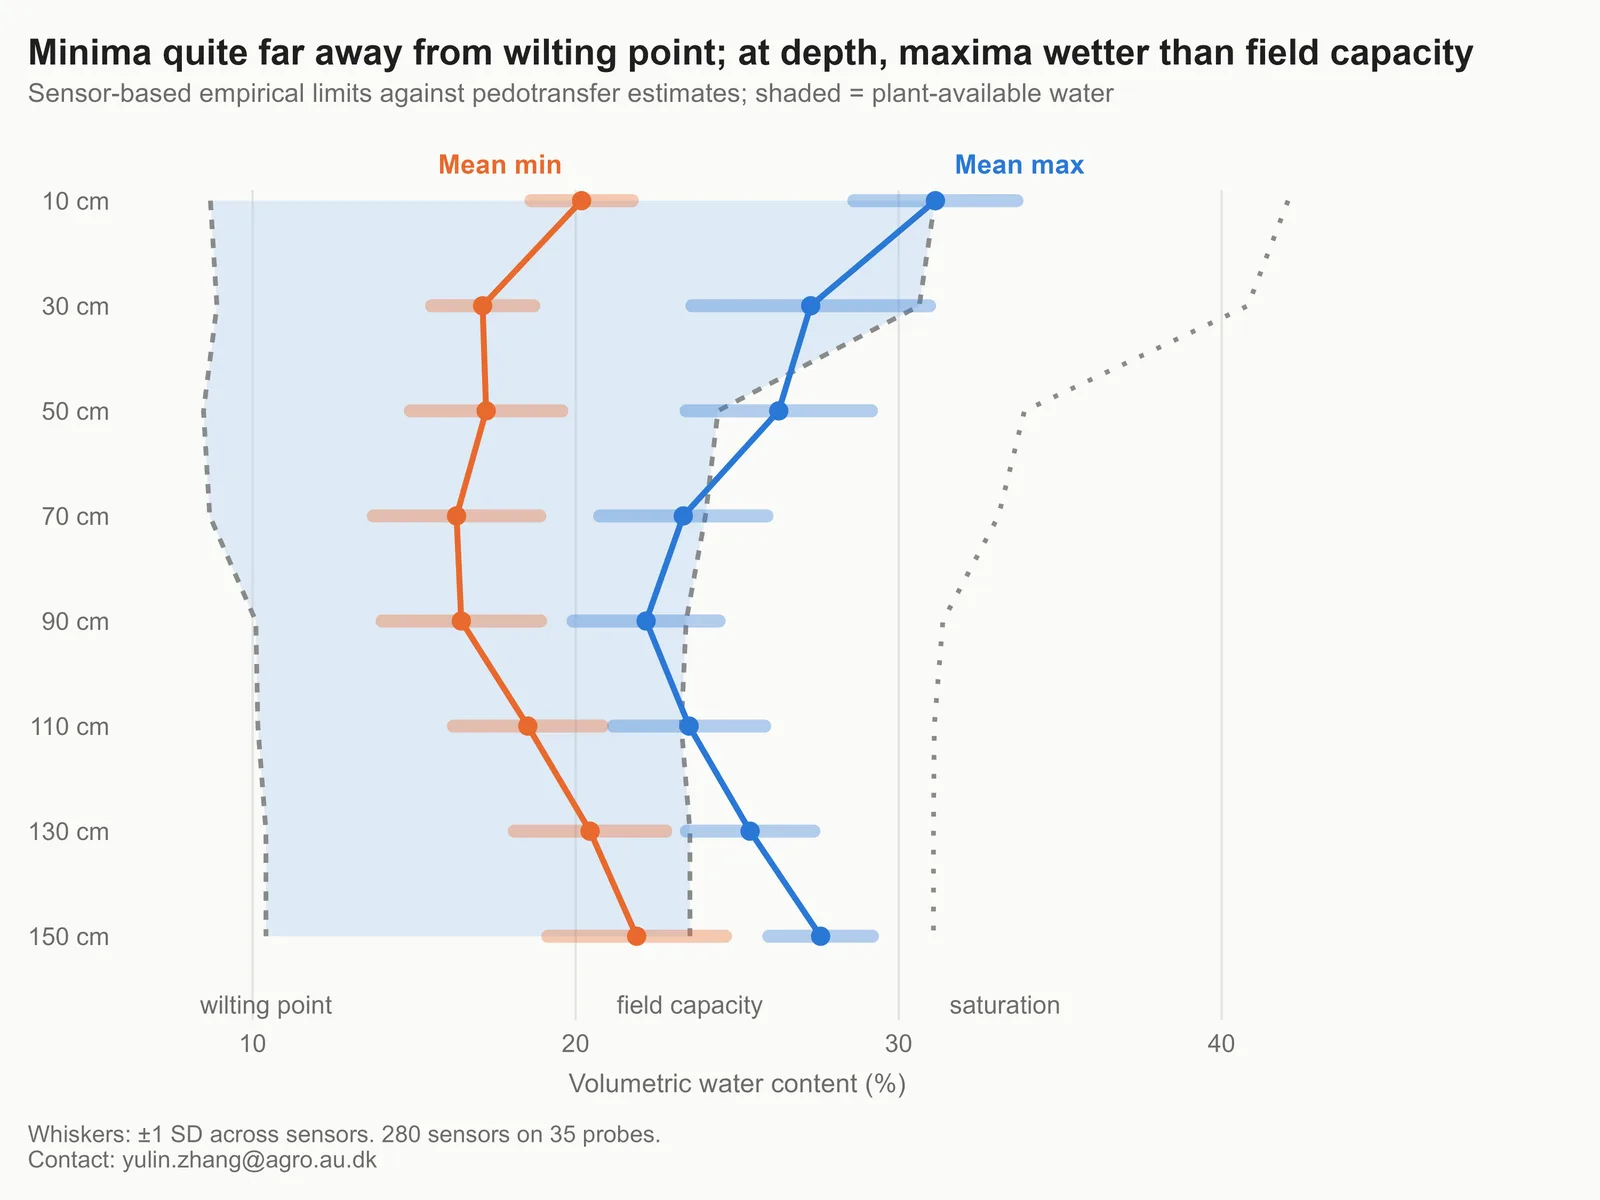
The lower boundaries, however, deserve more attention. In central Denmark, dry spells rarely last long, so we almost never see truly dry soil in this trial. Nonetheless, these conditions are truly interesting: they show how thirsty our crops exactly are, and where and when they draw the most water.
- FC: the amount of water a soil holds after excess water has drained away freely, typically a day or two after saturating rain or irrigation. Water above this level drains downward under gravity, so FC is the upper limit of plant-available water in practice. For a very dense soil, the porosity is so low that its FC can actually be very close to the total saturation!
- PWP: the soil water content at which plants can no longer extract water fast enough to recover from wilting, even when they’re placed in a humid environment. Water still remains in the soil at this point, but it’s held too tightly by soil particles for roots to take up - in short, very very dry soil.
Timing of boundary events
While identifying these boundaries, it was easy to record the date and week number of each one. The bar plot below counts how many boundary events occurred each week: the taller the bar, the more often the sensors reached a low or high VWC boundary that week. In total for each soil depth, there are precisely 35 "min" dates, and 35 "max" dates.
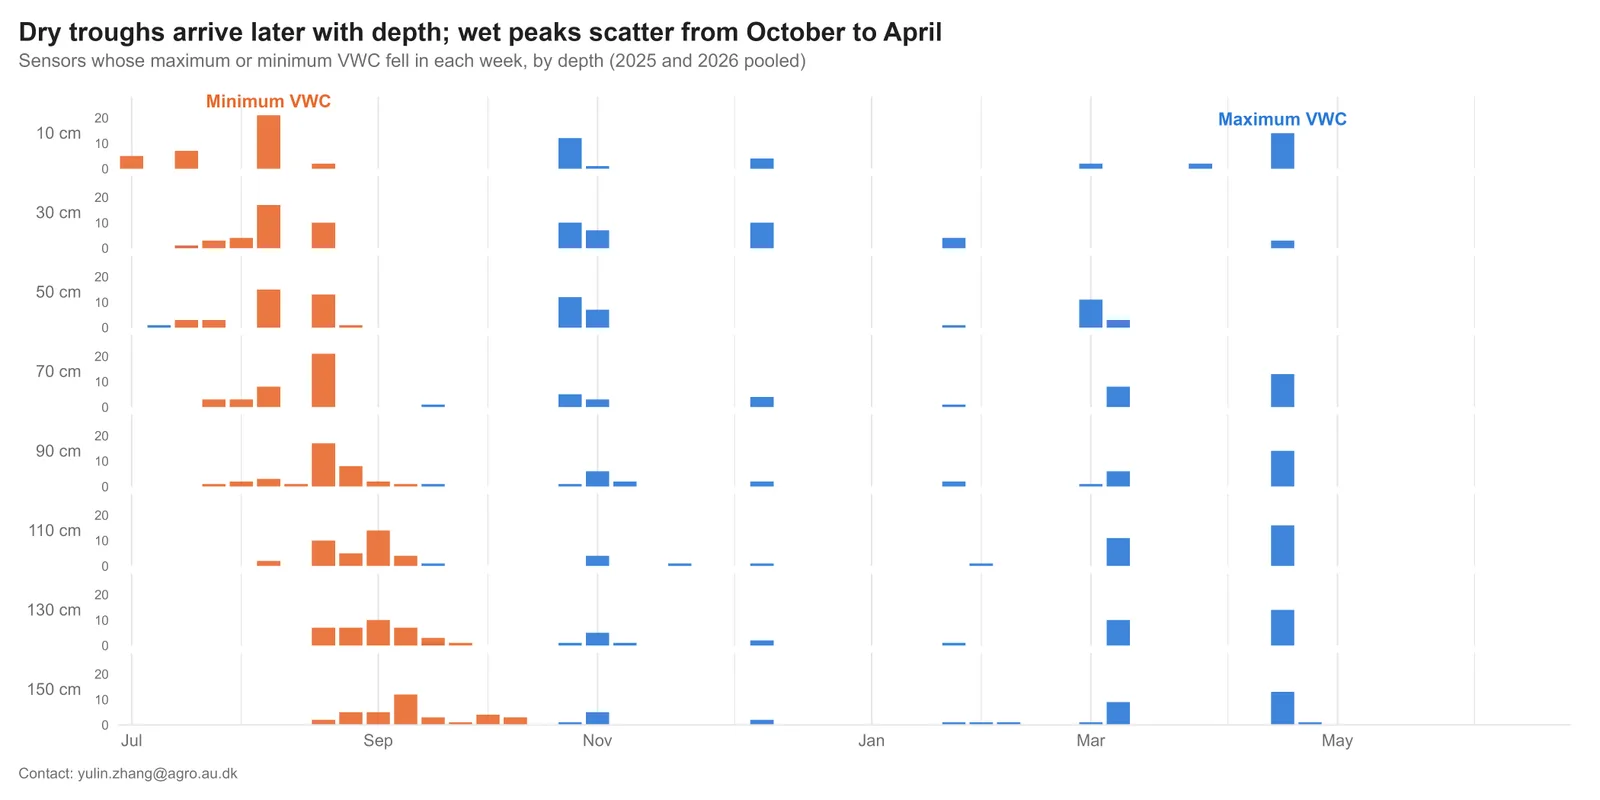
As expected (from my point of view), the minima mostly occur in summer, while the maxima are spread across autumn and winter and, most notably, early spring. This matters for modelers, who often assume the soil is at field capacity at the start of the growing season. Our sensors support that assumption.
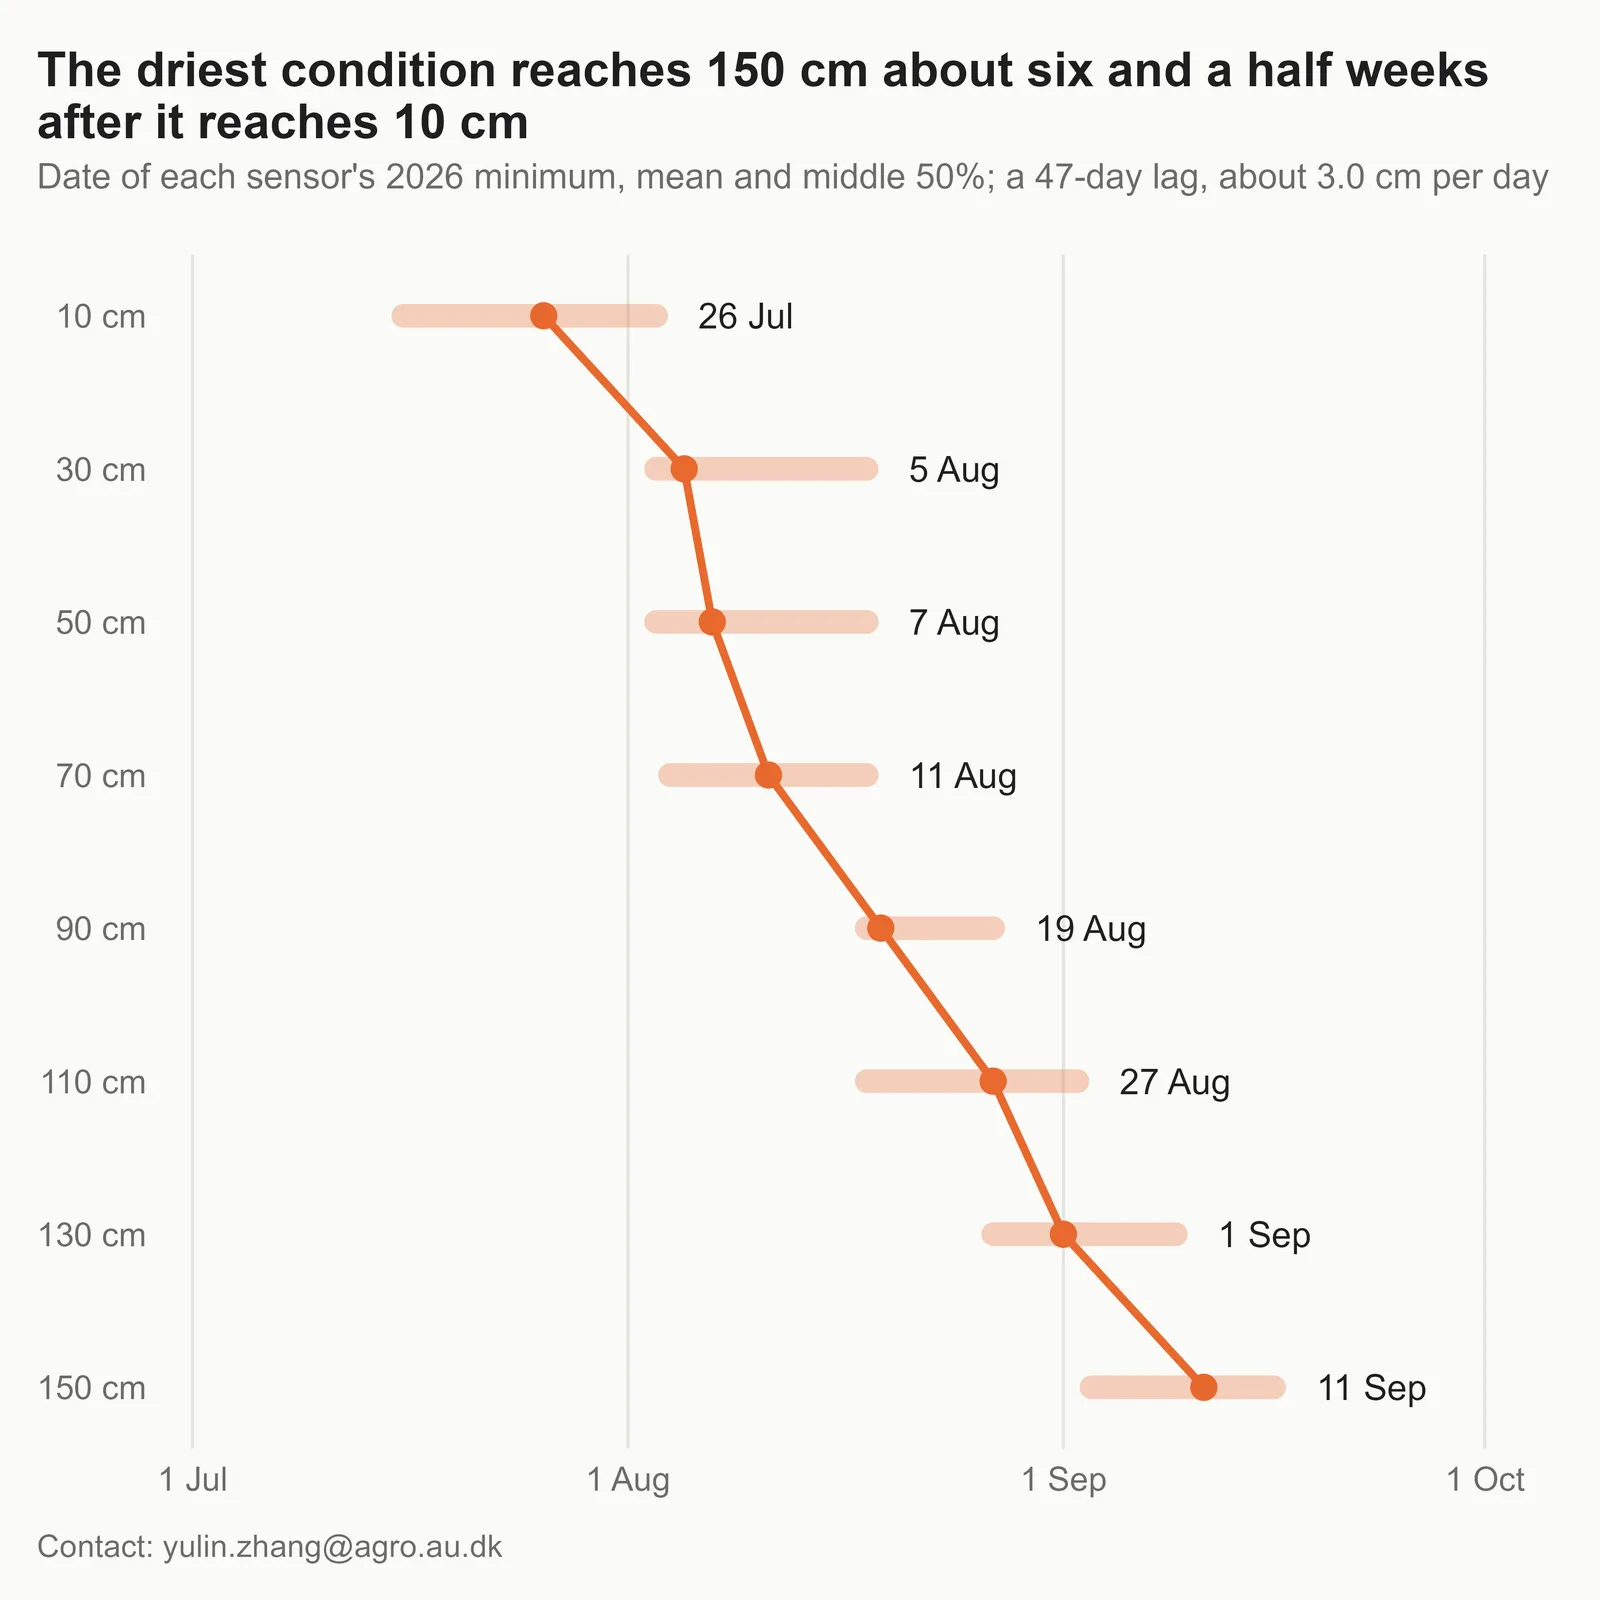
On the minima side, the bar plot hints at a lagged response. To make it clearer, the next figure shows the average date on which sensors at each depth reached their minimum. The “dry front” clearly moves step by step from the topsoil down to the subsoil. Evaporation strongly affects the topsoil, but what drives the drying all the way down to 150 cm? Could it be our crops’ roots?
Crops use water differently
Staying with the VWC minima, we can then calculate the average minimum VWC for each depth and certain treatments in the trial. In the figure below, each line shows the driest soil conditions reached under a given treatment in summer 2026.
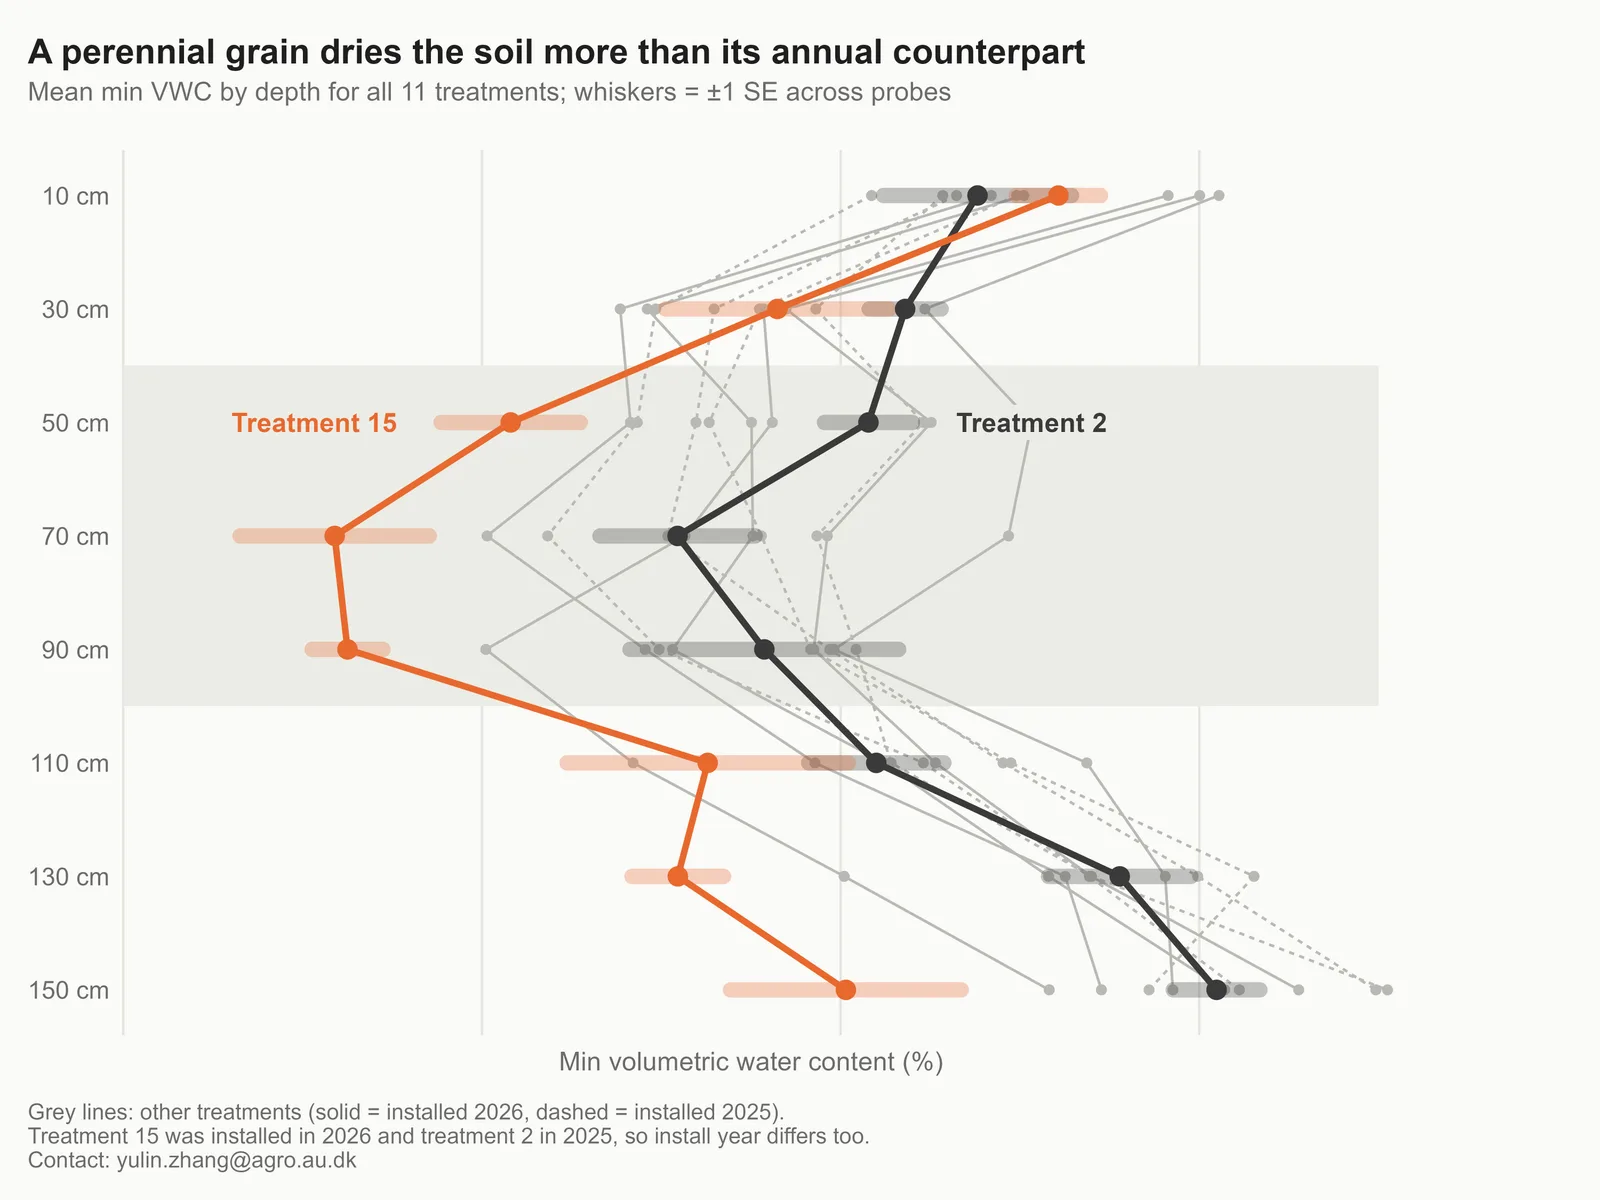
I’ve highlighted a perennial crop (orange) and its annual counterpart (black). Look how different they are! My colleague, Alexa Peterson, studies the agronomy of these crops and maybe she can tell me whether it is "worthy" for the perennial to utilize so much more water!
Future work
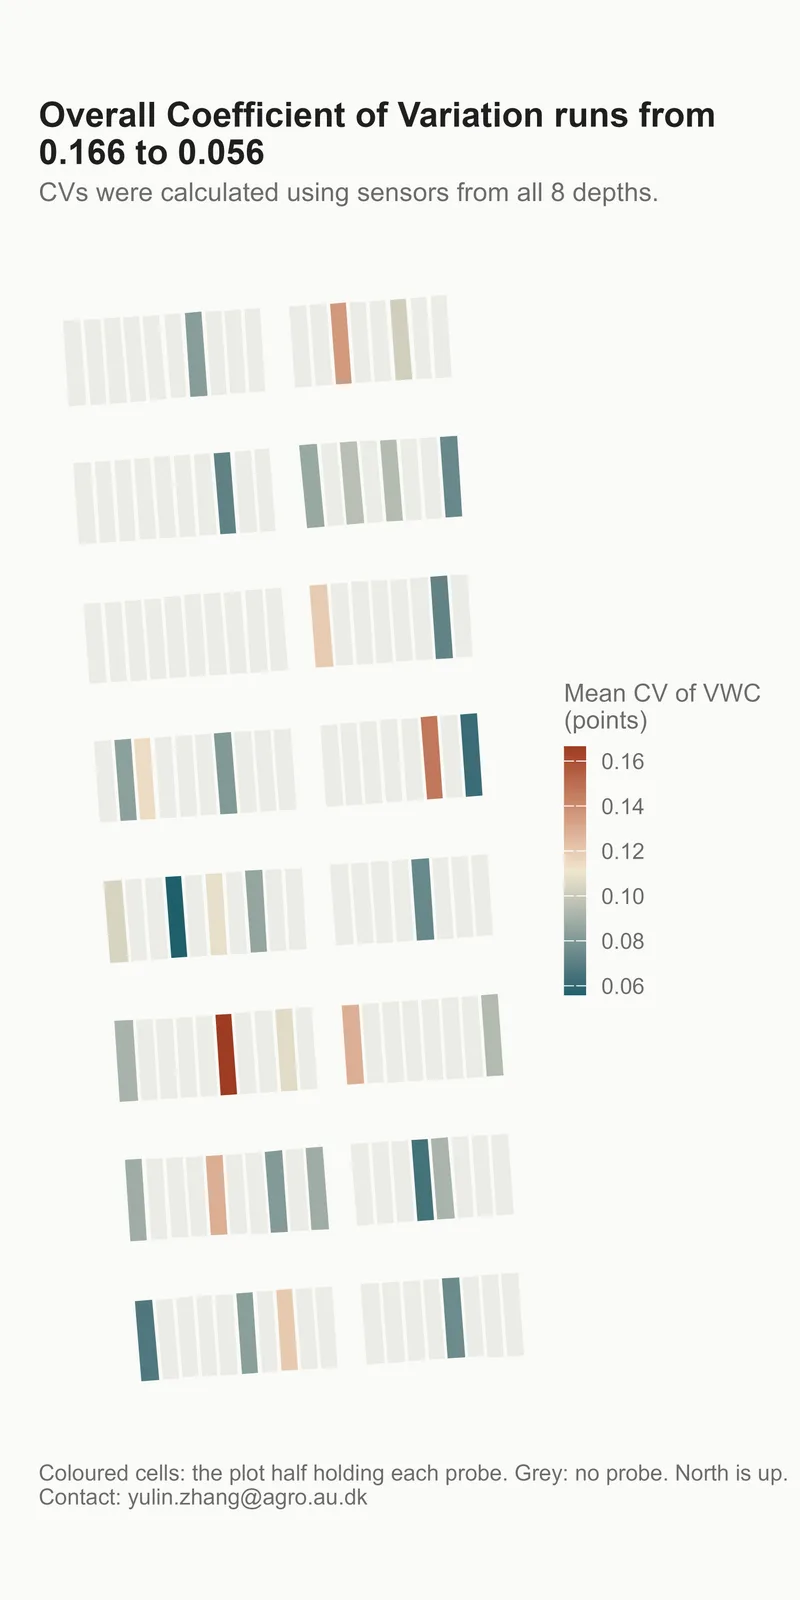
So far, all sensors have received the same calibration procedure, which I’ll describe in a paper I’m currently writing. A special thank you to Casandra Sabou for the help during soil sample collection. But this first year of data makes it clear that the sensors also vary among themselves: some are simply more responsive, or “sensitive,” than others. In the figure below, I calculated the coefficient of variation (standard deviation divided by mean VWC) for each probe. The higher a CV is, the more variable a sensor's readings are. The second row from the north appears noticeably more inert than the others. Does this mean some sensors need probe-specific calibration? We’ll find out.
Beyond that, I believe it’s our responsibility as researchers to extract the kind of insight that farmers and advisors, who don’t have all these sensors, can actually use, as a piece of knowledge. The sensors tell us precisely when and where soil water content changes, but it’s up to us to work out how the water actually moves, and why those changes happen.